
Lesson #61
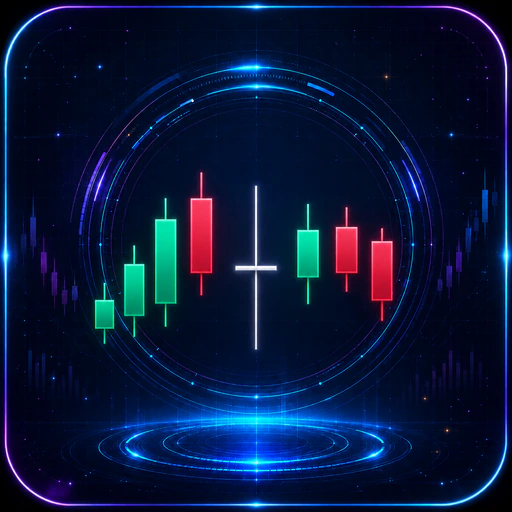
Doji Candlestick Pattern
Learn how the Doji candlestick shows market indecision when buyers and sellers finish near the same price.
Study candles that show pause, compression, or transition before the next confirmed context appears.
Learn how the Doji candlestick shows market indecision when buyers and sellers finish near the same price.
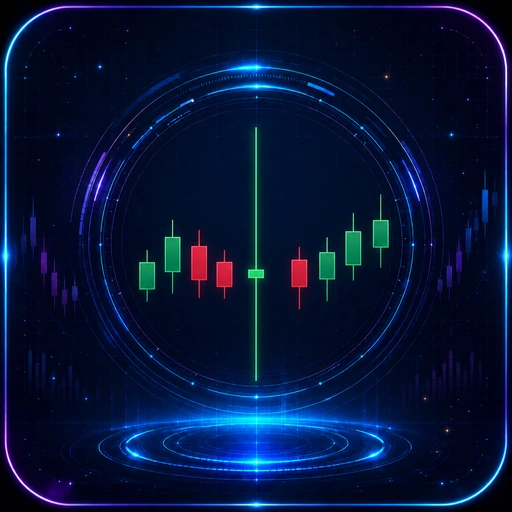
Learn how the High Wave Candle shows strong market uncertainty when both buyers and sellers push price far but neither side finishes in control.
Learn how the Long-Legged Doji shows strong market indecision when buyers and sellers both move price far but neither side wins the close.
Learn how the Marubozu shows strong momentum when price opens and closes near the extremes of the candle with little or no shadow.
Learn how the Spinning Top candlestick shows market indecision when buyers and sellers both push price but neither side finishes with strong control.
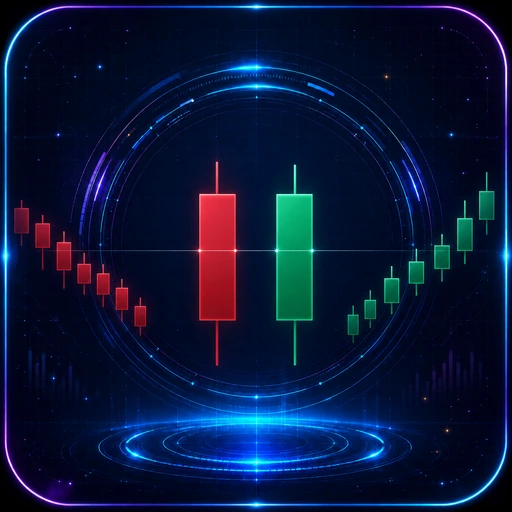
Learn how the Counterattack Lines pattern can signal a possible shift in control after a strong trend move.
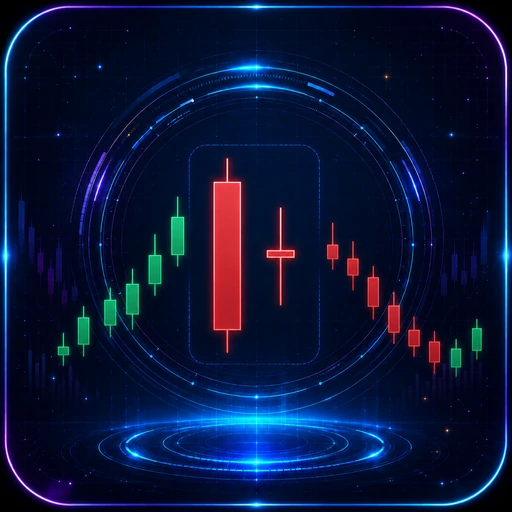
Learn how the Harami Cross shows a pause in momentum when a strong candle is followed by a small doji contained inside the prior candle's body.
Learn how a price gap creates a 'window' between candles and reveals strong market imbalance, momentum, or exhaustion depending on context.
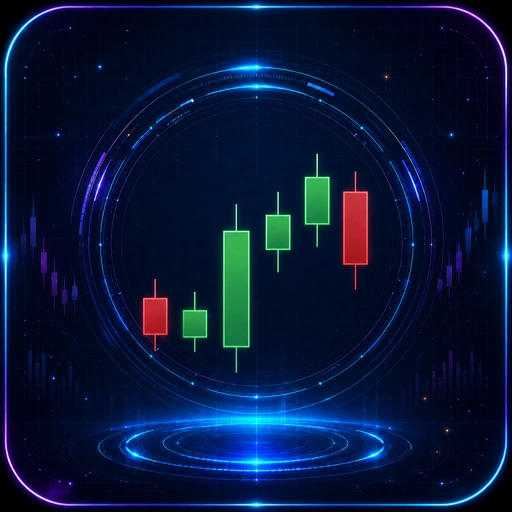

Learn how the Breakaway Pattern can signal a possible shift in momentum after a strong move, especially when it appears near key chart levels.
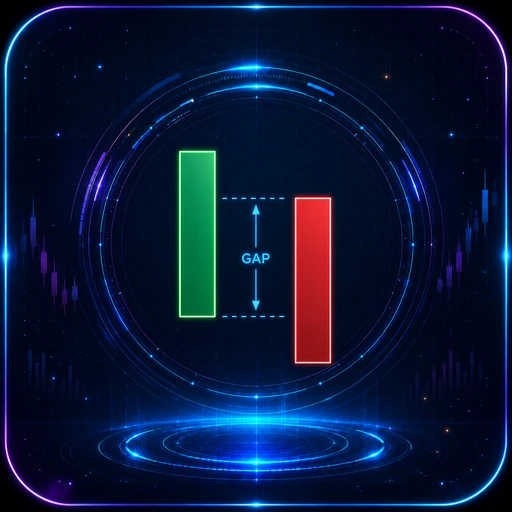
Learn how the Kicking Pattern shows a sharp shift in control when a strong candle gaps away from a prior marubozu in the opposite direction.
Learn how the Three Line Strike pattern can signal a strong reversal after three candles push in one direction and the next candle completely overwhelms them.